Lithium Tantalate Wafers are used in high-frequency, acoustic, optical, and piezoelectric devices where small changes in wafer geometry can affect lithography, film deposition, bonding, dicing, and final electrical performance. When users search for how wafer thickness and flatness affect device yield, they usually want more than a definition. They need a practical method for selecting specifications, measuring incoming material, finding the source of yield loss, and preventing expensive production rework.
This guide explains the relationship between thickness, total thickness variation, bow, warp, flatness, and device yield. It also provides a step-by-step inspection workflow, a tool list, purchasing guidance, and common mistakes to avoid when sourcing wafers from suppliers such as CQT.
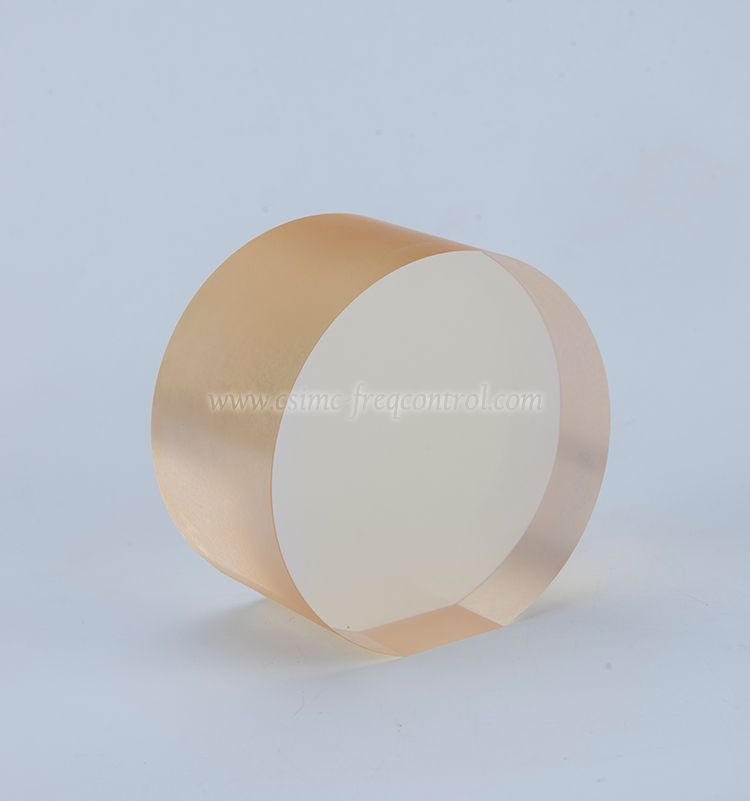
Understand Which Wafer Geometry Parameters Control Yield
Wafer thickness and flatness are related, but they describe different physical conditions. A purchasing team should define each parameter separately before comparing supplier quotations.
Thickness defines the average vertical dimension of the wafer
Wafer thickness is the distance between the front and back surfaces at a specified measurement location. It affects mechanical strength, acoustic behavior, handling, thermal transfer, and the final device design.
- Nominal thickness is the target average thickness, such as 100 micrometers, 300 micrometers, or 500 micrometers.
- Thickness tolerance is the allowed difference between the measured thickness and the specified nominal value.
- Thickness variation describes how much the thickness changes from one point on the wafer to another.
- Total thickness variation, commonly called TTV, is the difference between the maximum and minimum thickness values across the defined measurement area.
A wafer can meet its average thickness requirement while still having excessive TTV. For example, a wafer with an average thickness of 300 micrometers may be unsuitable if one edge is much thinner than the center. This condition can create nonuniform deposition, inconsistent etching, and variable mechanical resonance.
Flatness describes the wafer surface condition relative to a reference plane
Flatness describes how much a wafer surface deviates from an ideal reference plane. Depending on the measurement method, suppliers may use terms such as global flatness, site flatness, bow, or warp.
- Bow is the curvature of the wafer when the wafer is not constrained by a chuck or vacuum fixture.
- Warp is the total variation of the wafer surface from a reference plane, including both convex and concave deformation.
- Global flatness evaluates the wafer over a large area or the complete usable surface.
- Site flatness evaluates smaller local areas where individual devices are fabricated.
- Edge exclusion identifies the outer ring that is not included in the usable device area.
Flatness problems can cause poor contact with lithography chucks, uneven coating thickness, focus errors, partial bonding, and local mask gaps. The correct specification must identify the measurement area, reference plane, edge exclusion, temperature, and fixture condition.
Why TTV and flatness must be evaluated together
Thickness variation concerns the distance between the two wafer surfaces. Flatness concerns the shape of one surface or the overall wafer. A wafer may have low TTV but still show bow. It may also be flat on one side but have large thickness variation because the opposite surface is uneven.
For device yield analysis, review the following parameters as a group:
- Nominal thickness and tolerance.
- TTV across the full wafer and usable area.
- Front-side and back-side surface flatness.
- Bow and warp before and after processing.
- Surface roughness and polishing quality.
- Edge exclusion and usable device area.
- Particle, scratch, chip, and crack limits.
Identify the Device Yield Losses Caused by Thickness and Flatness
The purchasing group usually cares about more than the wafer invoice price. Their actual concern is whether wafer geometry will increase scrap, process interruptions, engineering adjustments, inspection time, and warranty risk.
Thickness variation changes process uniformity
When wafer thickness varies across the surface, the process stack can behave differently from one die location to another. This is especially important when the wafer is used as a piezoelectric substrate or when thin films are deposited on the wafer.
- Different mechanical thicknesses can shift the resonance frequency of acoustic devices.
- Uneven thermal paths can produce nonuniform heating during deposition, annealing, or bonding.
- Variation in wafer height can change the effective etch rate or endpoint response.
- Different focus heights can reduce lithography resolution and line-width control.
- Nonuniform backside contact can create local stress during polishing, coating, or bonding.
Flatness errors reduce lithography and pattern transfer yield
Photolithography systems rely on stable wafer contact and controlled focus. A bowed or warped wafer can move outside the equipment focus window, particularly when the process uses a small depth of focus.
Typical symptoms include:
- Line-width variation from the wafer center to the edge.
- Loss of critical dimension control.
- Incomplete exposure in areas with excessive wafer-to-mask spacing.
- Pattern distortion during stepper or scanner alignment.
- Resist thickness variation after spin coating.
- Localized defects caused by trapped air or poor chuck contact.
Warp and bow create bonding and assembly failures
Bonding processes require two surfaces to approach each other uniformly. Wafer curvature can prevent full contact and produce voids, delamination, or variable bond strength.
In wafer bonding, a purchasing team should evaluate:
- Flatness before bonding.
- Flatness after cleaning and dehydration.
- Surface roughness and waviness.
- Particle level and edge chips.
- Thermal expansion behavior during the bonding cycle.
- Warp after metallization, coating, or annealing.
Excessive variation increases mechanical and dicing risk
Thin or uneven wafers are more vulnerable to handling damage. Vacuum chucks, robotic end effectors, alignment pins, and dicing tape can apply stress to areas that are already mechanically weak.
Yield losses may appear as:
- Cracks that begin at the wafer edge.
- Chipping during wafer mounting or dicing.
- Breakage during cleaning or transport.
- Die corner damage after singulation.
- Variation in die thickness after back grinding.
Set Wafer Specifications Based on the Manufacturing Process
There is no single thickness or flatness value that is optimal for every device. The correct specification must be derived from the most sensitive process step and the required final device performance.
First step: define the device and process stack
Document the complete manufacturing flow before requesting a quotation. A supplier cannot recommend a reliable wafer specification if the application is described only as a general piezoelectric or RF device.
- Record the device type, such as resonator, filter, sensor, optical component, or actuator.
- Record the substrate material and crystal orientation.
- Record the starting wafer diameter and usable device area.
- List all deposition, lithography, etching, bonding, annealing, thinning, and dicing steps.
- Identify the process with the narrowest thickness or flatness tolerance.
- Define the acceptable electrical, optical, mechanical, and dimensional outputs.
Second step: convert process limits into wafer limits
Start with the equipment capability and process window. If a lithography process can tolerate only a limited focus variation, the wafer flatness specification must be tighter than that process limit. If the final resonance frequency has a strict tolerance, the thickness variation must be related to the device frequency sensitivity.
Use the following calculation logic:
- Determine the maximum process height variation that the equipment can accept.
- Subtract the expected variation from coating, films, fixtures, and thermal distortion.
- Reserve the remaining margin for incoming wafer bow, warp, and TTV.
- Verify the result with test wafers before freezing the production specification.
Do not simply copy a flatness value from another material or wafer size. A larger wafer, thinner substrate, different crystal orientation, or different polishing method may require a different control limit.
Third step: define acceptance criteria in measurable language
Every purchase specification should explain exactly how the value will be measured. Avoid statements such as "high flatness" or "uniform thickness" without a numeric limit and test method.
Include the following information:
- Nominal wafer thickness.
- Thickness tolerance.
- Maximum TTV.
- Maximum bow and warp.
- Measurement area and edge exclusion.
- Measurement temperature.
- Wafer orientation during measurement.
- Number of measurement points or scan resolution.
- Maximum surface roughness.
- Visual defect limits for scratches, chips, cracks, and particles.
- Certificate of conformance requirements.
- Sampling plan and lot definition.
Use the Correct Tools to Measure Thickness and Flatness
Measurement results are meaningful only when the instrument, fixture, calibration, and procedure match the parameter being measured. A low-cost thickness gauge may be adequate for incoming screening, but it may not provide the data needed to control advanced lithography or bonding.
Required tools for incoming wafer inspection
- Calibrated digital micrometer or contact thickness gauge for basic thickness checks.
- Noncontact optical thickness measurement system for fragile or contamination-sensitive wafers.
- Wafer mapping system for multi-point thickness and TTV measurement.
- Flatness, bow, and warp measurement tool using optical or capacitive sensing.
- Clean vacuum chuck or kinematic fixture.
- Temperature and humidity monitor.
- Calibrated reference standards or gauge blocks.
- Cleanroom gloves, wafer tweezers, and approved wafer containers.
- Particle inspection lighting or optical microscope.
- Data recording software with lot and wafer traceability.
Choose the measurement method according to the wafer risk
Contact measurement is simple and useful for a quick thickness check, but it can damage soft surfaces or produce inconsistent results if contact force is not controlled. Optical methods are faster and reduce contact risk, but they require correct material settings and surface conditions.
For high-value or high-sensitivity wafers, combine methods:
- Use a contact gauge for an initial thickness confirmation.
- Use a multi-point mapping system to calculate TTV.
- Use an optical flatness tool to evaluate bow and warp.
- Use microscopy to identify scratches, edge chips, and particles.
- Compare supplier data with internal measurements on the same sample lot.
Control the measurement environment
Temperature differences can change wafer dimensions and measurement results. Wafers should be allowed to stabilize in the inspection area before measurement. The fixture must be clean, level, and appropriate for the wafer diameter and thickness.
Control the following conditions:
- Allow wafers to reach the defined inspection temperature.
- Keep the measurement area free from vibration and airflow changes.
- Clean the wafer and fixture according to the approved procedure.
- Use the same edge exclusion for supplier and internal measurements.
- Record whether the wafer is free-standing, vacuum-held, or mechanically clamped.
- Calibrate instruments at the required frequency.
Follow a Step-by-Step Incoming Wafer Inspection Workflow
A repeatable inspection workflow helps distinguish a true supplier defect from a measurement error or a process-induced problem.
First step: verify the lot identity and documentation
- Match the shipping label with the purchase order.
- Confirm wafer material, crystal orientation, diameter, thickness, and surface finish.
- Check the certificate of analysis or certificate of conformance.
- Confirm the lot number, wafer count, packaging condition, and date of manufacture.
- Record any supplier-reported TTV, bow, warp, roughness, or defect data.
- Place any mismatch on quality hold before processing.
Second step: inspect packaging and visible wafer condition
- Inspect the outer package for impact, moisture, or seal damage.
- Open the container in the approved clean area.
- Check the wafer edges for chips, cracks, and handling marks.
- Inspect the front and back surfaces under controlled lighting.
- Record particles, scratches, stains, discoloration, and abnormal marks.
- Photograph representative defects and link the images to the lot number.
Third step: measure thickness at defined points
- Calibrate the thickness instrument using the approved reference standard.
- Place the wafer on a clean, stable fixture without excessive force.
- Measure the center point and a defined set of radial and circumferential points.
- Keep the same measurement pattern for every wafer in the sample.
- Record the minimum, maximum, average, and standard deviation.
- Calculate TTV as maximum thickness minus minimum thickness.
- Compare the result with the purchase specification and process limit.
Fourth step: measure bow, warp, and flatness
- Clean the flatness fixture and verify its calibration status.
- Place the wafer in the required free-standing or vacuum-held condition.
- Apply the specified edge exclusion and measurement area.
- Run the full wafer scan or the approved multi-point measurement pattern.
- Record bow, warp, global flatness, and site flatness when available.
- Repeat the measurement on a second orientation if the procedure requires it.
- Compare the map with the supplier report and retain the raw data.
Fifth step: correlate incoming data with device results
- Link each wafer measurement to its process history and device lot.
- Compare wafer maps with lithography defects, deposition variation, bonding voids, and electrical test results.
- Separate center, middle-radius, and edge performance.
- Check whether failures occur near the same location as high TTV or high warp.
- Use statistical analysis to determine whether geometry is a significant yield factor.
- Update the supplier specification only after confirming the relationship with process data.
Sixth step: release, quarantine, or escalate the lot
- Release the lot when all critical parameters meet the specification.
- Quarantine the lot when a measurement is out of specification or the data is incomplete.
- Request a supplier investigation when the internal result conflicts with the certificate.
- Use a controlled deviation only when engineering and quality teams approve the risk.
- Reject the lot when geometry defects are likely to create unacceptable device yield loss.
Compare Suppliers Using Total Cost and Process Risk
The lowest wafer price may not provide the lowest manufacturing cost. Purchasing decisions should include the cost of yield loss, inspection, rework, expedited replacement, and equipment downtime.
Request the data needed for a meaningful supplier comparison
- Thickness specification and actual process capability.
- TTV distribution by wafer and by production lot.
- Bow and warp measurement method.
- Flatness map or representative measurement report.
- Surface roughness and polishing information.
- Crystal orientation and material composition.
- Wafer diameter, usable area, and edge exclusion.
- Cleaning, packaging, and shipping conditions.
- Sampling plan and replacement policy.
- Traceability from raw material to finished wafer.
- Ability to provide engineering samples and process capability data.
Use a supplier qualification sequence
- Send the supplier a complete technical specification and intended process flow.
- Request a small sample lot with full measurement data.
- Measure the samples internally using a documented method.
- Run the wafers through the most sensitive device process steps.
- Compare yield, electrical distribution, bonding quality, and defect maps.
- Review differences between supplier and internal measurements.
- Approve the supplier only after quality, engineering, and purchasing sign off.
- Establish ongoing lot monitoring and periodic requalification.
Evaluate CQT with a process-focused checklist
When discussing Lithium Tantalate Wafers with CQT, ask for specifications that are directly connected to the intended device process. The quotation should identify the nominal thickness, allowed TTV, flatness definition, edge exclusion, surface finish, inspection method, packaging standard, and lot acceptance criteria.
A useful supplier discussion should also address:
- Whether the requested geometry can be maintained across the full wafer diameter.
- How thickness and flatness are controlled during grinding and polishing.
- How wafers are protected from edge damage during cleaning and packaging.
- Whether sample measurement maps can be provided before mass production.
- How nonconforming wafers are identified, segregated, and replaced.
- Whether engineering changes require prior customer notification.
Avoid Common Measurement and Purchasing Mistakes
Many wafer-related yield problems come from unclear specifications or inconsistent inspection rather than from an inherently unsuitable material.
Do not confuse average thickness with uniform thickness
An average value can hide local defects. Always request the minimum, maximum, average, and TTV values, preferably with a wafer map. A supplier certificate that reports only average thickness is not sufficient for a process with tight uniformity requirements.
Do not specify flatness without defining the measurement condition
Flatness results can change depending on whether the wafer is free-standing, vacuum-held, or clamped. The result can also change with edge exclusion, temperature, scan density, and reference plane. Put these conditions into the purchase specification.
Do not measure a contaminated or poorly supported wafer
Particles under the wafer can create false bow or thickness readings. A tilted fixture can produce a misleading flatness map. Clean the fixture, verify support conditions, and repeat suspicious measurements before making a supplier claim.
Do not use excessive contact force
High contact force can deflect thin wafers or damage polished surfaces. Use the lowest validated force and prefer noncontact measurement when the wafer is fragile, thin, or contamination-sensitive.
Do not ignore process-induced wafer deformation
A wafer that passes incoming inspection can develop bow or warp after coating, metallization, annealing, bonding, or backside grinding. Measure critical intermediate states when the process stack can introduce stress.
Do not tighten specifications without evidence
Overly strict specifications can raise cost and reduce the available supplier base without improving yield. Use design of experiments, yield correlation, and process capability data to identify the limits that actually matter.
Do not accept a supplier report without traceable raw data
Ask whether the report identifies the instrument, calibration status, measurement pattern, edge exclusion, operator, and wafer number. Traceable data makes it easier to compare lots and resolve disputes.
Build a Practical Wafer Yield Control Plan
A stable control plan connects purchasing, incoming quality, process engineering, and final device testing. It should define who owns each measurement and what action is taken when a limit is exceeded.
Set control limits at three levels
- Supplier release limits control the wafer before shipment.
- Incoming inspection limits confirm that the received lot matches the purchase order.
- Process control limits identify geometry changes that may affect production yield.
Do not use the same limit automatically for all three levels. The supplier release limit may be tighter than the customer acceptance limit, while the process alert limit may be designed to identify a trend before the specification is exceeded.
Track trends instead of reviewing only failures
Plot thickness, TTV, bow, warp, particle counts, and device yield by lot. A gradual increase in TTV may indicate polishing tool wear even when every lot still passes the formal specification.
Review these trends regularly:
- Average and standard deviation by supplier lot.
- Maximum and minimum wafer values.
- Center-to-edge thickness profile.
- Wafer geometry before and after major process steps.
- Correlation between geometry maps and electrical test maps.
- Frequency of cracks, chips, voids, and handling damage.
Use a corrective action sequence when yield drops
- Confirm that the measurement system is calibrated and repeatable.
- Check whether the yield loss is concentrated in one wafer lot or supplier lot.
- Compare current thickness and flatness maps with historical good lots.
- Check process equipment focus, chuck vacuum, coating uniformity, and bonding pressure.
- Inspect for contamination, particles, cracks, and edge damage.
- Run a controlled comparison using wafers with different geometry values.
- Identify the parameter with the strongest relationship to the failure mode.
- Implement a supplier or process corrective action.
- Verify improvement through multiple production lots.
Use This Purchasing Checklist Before Ordering
Before ordering Lithium Tantalate Wafers, the purchasing group should confirm that the supplier can meet the technical requirement and provide evidence that the requirement is controlled in production.
Technical specification checklist
- Material and crystal orientation are clearly identified.
- Wafer diameter and usable area are stated.
- Nominal thickness and tolerance are stated.
- TTV limit and measurement pattern are stated.
- Bow, warp, and flatness limits are separately stated.
- Edge exclusion is defined.
- Surface roughness and polishing grade are defined.
- Particle, scratch, crack, and chip limits are included.
- Packaging and cleanliness requirements are included.
- Certificate and inspection data requirements are included.
Supplier capability checklist
- Can the supplier provide representative wafer maps?
- Can the supplier provide engineering samples before production release?
- Is the measurement equipment calibrated and traceable?
- Are lots fully traceable?
- Can the supplier explain its grinding and polishing controls?
- Does the supplier have a defined nonconformance response process?
- Can the supplier maintain the requirement across repeated lots?
- Does the supplier support technical communication between quality and process engineers?
Final decision rule
Select the supplier that provides the best combination of geometry capability, measurement transparency, material consistency, delivery reliability, and total process cost. A wafer with a slightly higher purchase price may be the better choice if it reduces lithography defects, bonding voids, dicing breakage, and electrical test failures.
When the specification, inspection method, and process correlation are clearly defined, wafer thickness and flatness become controllable yield variables rather than unexpected sources of scrap. For applications requiring stable device performance, work with a technically qualified supplier such as CQT and confirm the complete geometry data before production release. Consistently controlled Lithium Tantalate Wafers can help manufacturers improve process repeatability, protect device yield, and reduce the total cost of production.









 中文


