


 中文


Choosing a wafer by “lithium niobate” alone is not enough for an RF device. The correct decision depends on the target frequency, acoustic mode, crystal cut, electrode stack, wafer thickness, loss budget, and inspection data. This guide explains how to choose Lithium Niobate Wafers for high-frequency RF applications, including lithium niobate wafer orientation for SAW filters and thin-film lithium niobate RF resonator wafers. The key terms are electromechanical coupling coefficient, surface acoustic wave filters, and vector network analyzer.
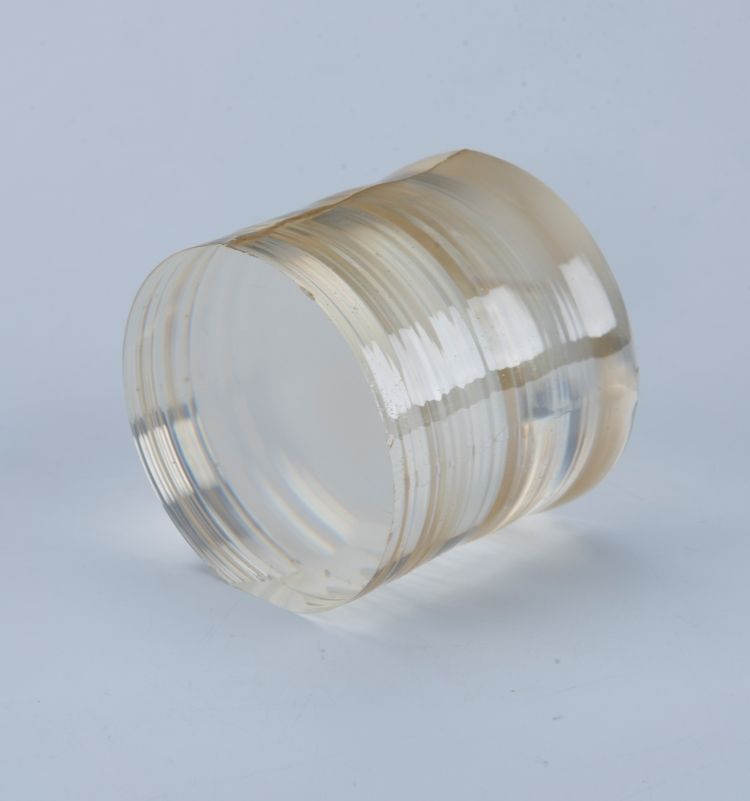
Lithium niobate (LiNbO3) is a ferroelectric, piezoelectric crystal with a Curie temperature commonly reported near 1,148 K, or approximately 875 °C. Its density is about 4.64 g/cm3. The material is attractive for radio-frequency acoustic devices because several crystal cuts provide strong piezoelectric coupling, allowing efficient conversion between an electrical signal and an acoustic wave.
That same coupling can create design problems. A wafer with strong coupling may produce a wide filter bandwidth but can also increase spurious modes, temperature sensitivity, or impedance variation. A wafer that performs well in a 100 MHz surface acoustic wave device may not be the best choice for a 3.5 GHz thin-film bulk acoustic or Lamb-wave resonator.
In practical procurement, the most consequential variables are:
- Crystal cut and propagation direction: Y-cut, rotated Y-cut, X-cut, Z-cut, and custom cuts produce different acoustic velocities and coupling.
- Material form: bulk LiNbO3, lithium-niobate-on-insulator (LNOI), or a bonded LiNbO3/Si or LiNbO3/sapphire stack.
- Film thickness: the acoustic wavelength-to-film-thickness ratio controls modal confinement in thin-film devices.
- Surface quality: roughness, particles, pits, edge exclusion, and bow affect lithography and electrode continuity.
- Electrical and optical grade: 5 mol% MgO-doped material, for example, is often selected for improved photorefractive resistance, but it is not automatically the best RF material.
- Thermal and mechanical stack: silicon, sapphire, quartz, or another handle wafer changes heat spreading, acoustic leakage, and packaging stress.
Why Lithium Niobate Wafer Selection Determines RF Performance
Define the RF Application Before Buying Lithium Niobate Wafers
Start with the device architecture rather than the supplier catalog.
| Device type | Typical wafer question | Primary selection variables |
|---|---|---|
| SAW filter or resonator | Will the selected cut support the required Rayleigh, shear-horizontal, or leaky mode? | Cut, propagation angle, acoustic velocity, coupling, temperature coefficient, surface roughness |
| Thin-film acoustic resonator | Is the LiNbO3 layer thick and uniform enough for the intended mode? | Film thickness, crystalline orientation, bonding voids, handle wafer, electrode stress |
| Guided-wave or Lamb-wave device | Does the film/handle stack confine the mode without excessive leakage? | Film-to-wavelength ratio, undercut or isolation layer, anisotropy, substrate acoustic impedance |
| RF photonic or electro-optic device | Can one wafer meet both RF loss and optical propagation requirements? | Optical absorption, propagation loss, electrode spacing, crystal axis, optical damage resistance |
Match Lithium Niobate Wafers to the Acoustic Device Type
For a first-order acoustic design, use:
f = v / λ
where f is frequency, v is phase velocity, and λ is acoustic wavelength. If the acoustic velocity is approximately 3,500 m/s, a 3.5 GHz device has a nominal wavelength of about 1.0 µm. An interdigital transducer with four fingers per wavelength would then require a nominal finger pitch near 250 nm. The exact velocity is cut- and mode-dependent, so this calculation is for feasibility, not final mask release.
At submicrometre pitches, wafer bow and local thickness variation can become as important as the nominal crystal quality. A procurement specification should therefore include:
- Target frequency and bandwidth.
- Chosen acoustic mode and simulated phase velocity.
- Required film thickness and permitted thickness variation.
- Maximum wafer bow and warp.
- Maximum particle count at the intended lithography size.
- Maximum surface roughness, preferably reported as Ra or RMS with the scan length and instrument stated.
- Maximum bonding-void area for LNOI wafers.
- Edge exclusion and usable die area.
Translate Frequency into Lithography and Wafer Requirements
How to Choose Lithium Niobate Wafer Orientation for SAW Filters
LiNbO3 is anisotropic. The same nominal wafer cut can produce different behavior when the propagation direction changes. The relevant parameters include:
- Phase velocity: determines the wavelength required for a target frequency.
- Electromechanical coupling coefficient, k2: indicates how strongly electrical energy couples to acoustic energy. It is not a universal material constant for every device; the measured value depends on the mode, cut, electrode geometry, and loading.
- Temperature coefficient of frequency, TCF: determines frequency drift with temperature.
- Power-handling behavior: influenced by electrode heating, acoustic loss, dielectric loss, and defect density.
- Spurious-mode spectrum: affected by anisotropy, aperture, reflections, and the substrate stack.
Do not accept a supplier statement such as “high coupling” without asking for the measurement method, mode, propagation direction, electrode thickness, and temperature. A reported k2 from a one-port resonator cannot be transferred directly to a different SAW geometry.
Crystal Cut, Propagation Angle, and Electromechanical Coupling
Bulk wafers are appropriate when the acoustic wave is intended to propagate in the crystal itself and the process does not require a thin-film isolation layer. They can simplify handling and reduce bonding-related defects.
LNOI wafers are selected when a thin LiNbO3 layer must be integrated with a low-loss or thermally conductive handle wafer. The structure may improve modal confinement and support small feature sizes, but it adds inspection requirements: bonding voids, interface particles, film thickness nonuniformity, edge delamination, and stress-induced bow.
For a thin-film device, request the actual thickness map rather than a center-point measurement. A 300 nm nominal film with a 3% thickness range can produce a different local resonance than a 300 nm film with a 10% range, especially when the acoustic mode is strongly confined to the film.
Bulk Lithium Niobate versus Thin-Film Lithium Niobate
Required Preparation for Purchasing Lithium Niobate RF Wafers
Prepare the following before requesting quotations from CQT or another qualified wafer supplier:
- Device design: frequency, bandwidth, impedance, mode, aperture, electrode material, electrode thickness, and expected RF power.
- Crystal specification: cut, propagation direction, doping, optical grade if relevant, and ferroelectric domain requirement.
- Wafer geometry: diameter, thickness, notch or flat orientation, edge exclusion, and usable die dimensions.
- Surface specification: single-side or double-side polish, roughness measurement method, particle limits, scratches, pits, stains, and haze.
- Bonding specification: handle substrate, bonding method, void limit, interface inspection method, and permitted bow.
- Traceability requirement: lot number, boule number if available, inspection date, metrology equipment, calibration status, and certificate of conformance.
Documents and Technical Inputs
- Calibrated optical microscope for edge, scratch, pit, and particle inspection.
- White-light interferometer or calibrated AFM for surface topography.
- Stylus profilometer or spectroscopic ellipsometer for film thickness.
- Laser scanning tool or equivalent particle inspection system.
- Bow and warp measurement tool using a documented wafer reference plane.
- Four-point probe or sheet-resistance tool for conductive films, if present.
- Scanning acoustic microscope, infrared inspection, or equivalent method for bonded-interface defects.
- Probe station and calibrated vector network analyzer for RF coupon testing.
- Temperature-controlled chuck or chamber for TCF measurements.
Use an ISO/IEC 17025-accredited laboratory when an independent measurement is required, and request the calibration uncertainty for each instrument. A number without uncertainty, scan area, probe type, or calibration status is not sufficient for comparing lots.
Tools for Wafer Evaluation
Step-by-Step Lithium Niobate Wafer Selection Process
Tools: electromagnetic simulator, acoustic finite-element model, spreadsheet, device mask data.
Action: calculate the first-order wavelength from the target frequency and the simulated acoustic velocity. Specify the desired mode, coupling range, temperature range, RF power, and acceptable insertion-loss and frequency-drift limits.
Parameters: record frequency in Hz, wavelength in metres, film thickness in nanometres or micrometres, electrode thickness, aperture, and expected die location on the wafer.
Check: verify that the smallest mask feature is compatible with the intended lithography process and that the chosen film thickness supports the simulated mode.
Failure fix: if the calculated pitch is below the process capability, consider a different mode, a higher-velocity orientation, a thinner electrode, or a different device architecture. Do not solve a lithography limitation by accepting an unverified crystal cut.
Step 1: Convert the RF Target into a Wafer Specification
Tools: supplier orientation drawing, X-ray diffraction or Laue back-reflection data, crystal-axis reference.
Action: ask the supplier to define the cut and propagation direction using a clear coordinate convention. “128° Y-cut” or “X-cut” should be accompanied by the wafer normal, in-plane direction, and angular tolerance.
Parameters: specify orientation tolerance in degrees, not only the cut name. For a sensitive high-frequency design, request the measured or certified angular deviation for each lot.
Check: compare the supplier drawing with the simulation coordinate system. Confirm that the electrode direction in the mask corresponds to the crystal direction used in the model.
Failure fix: if the supplier and design teams use different axis conventions, stop the release and redraw the coordinate system. Many apparent “material failures” are actually propagation-direction errors.
Step 2: Confirm the Lithium Niobate Crystal Cut and Axis Convention
Tools: acoustic simulation, thermal model, bonding-interface inspection report.
Action: compare bulk LiNbO3 with LNOI using acoustic leakage, heat dissipation, packaging, and process complexity as decision criteria.
Parameters: record LiNbO3 thickness, handle-wafer material and thickness, buried oxide thickness if used, bonding method, total wafer thickness, and bow.
Check: inspect whether the simulated acoustic field reaches the handle wafer. A mode that leaks into the substrate can show reduced Q and increased insertion loss.
Failure fix: if Q is lower than expected, compare a thicker isolation layer, a different handle wafer, an acoustic reflector, or a bulk configuration. Also rule out electrode loss and probe-pad parasitics before blaming the wafer.
Step 3: Select Bulk or LNOI Construction
Tools: AFM or optical profiler, ellipsometer, profilometer, bow mapper, inspection microscope.
Action: request a wafer map rather than a single measurement. For a thin-film wafer, obtain thickness at the center and at multiple radial positions. For polished bulk wafers, obtain roughness data with scan length and filtering conditions.
Parameters: review RMS or Ra roughness, film-thickness range, total thickness variation, bow, warp, edge exclusion, particle count, scratch length, pit size, and haze classification.
Check: compare all values with the process window. For example, if the lithography process cannot tolerate a local height change greater than 20 nm, a supplier’s “uniform” label is not meaningful unless the actual map demonstrates compliance.
Failure fix: quarantine wafers with unexplained local thickness steps, edge delamination, or particles in the active area. Ask for re-polishing only when the supplier can demonstrate that the rework will not change orientation, stress, or film thickness beyond the design window.
Step 4: Review Surface, Thickness, and Bow Data
Tools: calibrated vector network analyzer, calibration substrate, probe station, temperature chuck, RF test coupon.
Action: fabricate identical resonators or delay lines at several wafer locations. Calibrate the VNA at the probe tips using SOLT, TRL, or another method appropriate to the fixture and frequency range.
Parameters: measure resonance frequency, antiresonance frequency, Q, effective coupling, impedance, insertion loss, return loss, and temperature drift. Record probe force, contact method, RF power, sweep bandwidth, IF bandwidth, averaging, and calibration date.
Check: compare center, middle-radius, and edge dies. A large radial shift indicates thickness, orientation, stress, or process nonuniformity. Repeat selected measurements after thermal cycling to separate permanent drift from reversible TCF.
Failure fix: if the resonance is shifted but Q is normal, investigate thickness and orientation. If Q is low, investigate surface scattering, electrode resistance, interface leakage, packaging, and calibration. If the response contains extra peaks, examine spurious modes and acoustic reflections before changing the nominal frequency.
Step 5: Verify Electrical and RF Performance on Test Coupons
Tools: incoming-inspection checklist, statistical process-control sheet, certificate-of-conformance review.
Action: define acceptance criteria before receiving the wafers. Separate critical-to-function characteristics from cosmetic characteristics.
Parameters: include lot size, sample size, allowable nonconforming wafers, critical defect definitions, retest rules, and disposition authority.
Check: verify that the certificate matches the physical lot, wafer ID, orientation, thickness, doping, and inspection results. Confirm that the measurement method is the same as the method used during supplier qualification.
Failure fix: reject or hold the lot when traceability is incomplete. Do not mix wafers from different boule lots in a process-development split unless the experiment is designed to measure lot-to-lot variation.
Step 6: Approve the Lot with a Written Acceptance Plan
Verified Technical References and Practical User Cases
Published Lithium Niobate RF and Acoustic Device Evidence
Published research provides useful evidence that wafer architecture changes device performance, but published numbers must not be copied directly into a purchasing specification. For example, thin-film lithium niobate acoustic resonator research has demonstrated GHz-range operation using submicrometre films and lithographically defined electrodes. These studies typically report resonance frequency, Q, coupling, and temperature behavior together because no single parameter predicts product performance.
A well-known documented industry case is the use of lithium niobate in high-speed electro-optic modulators for optical communications. Research and commercial device literature show that thin-film LiNbO3 platforms can combine microwave electrodes with optical waveguides. This is a verified application category, but an electro-optic modulator wafer should not automatically be treated as an RF acoustic wafer: optical-grade polishing, electrode loss, RF mode confinement, and acoustic leakage are different qualification requirements.
For a project review, use primary sources such as IEEE Xplore papers, peer-reviewed journal articles, supplier process notes, and accredited laboratory reports. Record the exact wafer cut, film thickness, handle substrate, electrode stack, measurement frequency, and Q definition. Without those details, a published result is background evidence rather than a transferable benchmark.
How to Use a Real Customer or Published Case Without Overclaiming
When a CQT customer or research group provides permission to publish data, a useful case record should include the application, wafer construction, process split, measurement equipment, and before-and-after result. For example, a defensible case format is: “The team compared two crystal orientations on identical resonator masks, measured S-parameters with a calibrated VNA, and selected the orientation with the lower frequency spread across the wafer.” The numerical result should be included only when the project owner has released it.
This approach avoids inventing a personal success story or assigning an unverified conversion claim to CQT. In a technical buying decision, traceable lot data is more useful than an anonymous statement that a wafer was “excellent.”
Common Lithium Niobate Wafer Selection Errors and Solutions
Error 1: Choosing the Wafer by Cut Name Alone
Problem: the same cut can behave differently with a different propagation direction, mode, electrode loading, or substrate.
Solution: require a complete orientation drawing and reproduce that coordinate system in the simulation and mask documentation.
Error 2: Treating k2 as a Guaranteed Filter Bandwidth
Problem: effective coupling depends on geometry and mode. A material-level or literature value does not guarantee the bandwidth of a finished filter.
Solution: measure fabricated test structures and report the extraction method. Use the same electrode thickness and loading as the product design.
Error 3: Ignoring Thermal Drift
Problem: LiNbO3 devices can show measurable frequency movement with temperature, while packaging stress and electrode heating add further shifts.
Solution: measure TCF over the actual operating range. If the application requires frequency stability, evaluate temperature compensation, a multilayer stack, a different mode, or closed-loop correction.
Error 4: Accepting a Single-Point Thickness Measurement
Problem: local thickness variation changes acoustic velocity and resonance frequency, particularly in submicrometre thin films.
Solution: request center, radial, and edge measurements or a full wafer map. Link every die measurement to its wafer coordinates.
Error 5: Measuring RF Performance Without Proper Calibration
Problem: probe-pad parasitics, cable loss, fixture reflections, and poor calibration can be mistaken for material loss.
Solution: calibrate at the probe plane, document SOLT or TRL standards, use de-embedding structures, control RF power, and repeat measurements on a reference device.
Error 6: Confusing Optical Quality with RF Quality
Problem: a wafer suitable for an optical modulator may have bonding, acoustic leakage, electrode, or surface requirements that differ from an RF resonator.
Solution: qualify the exact device process. Ask for RF test coupons, not only optical transmission or visual-polish data.
Error 7: Failing to Control Contamination and Handling
Problem: lithium niobate wafers can be damaged by particles, metal contamination, improper vacuum handling, or incompatible cleaning chemistry.
Solution: define packaging, cassette material, cleanroom class, wafer-contact points, cleaning sequence, and storage humidity. Confirm chemical compatibility with the supplier and process engineer before using solvents or strong acids.
How to Compare CQT and Other Lithium Niobate Wafer Suppliers
Use a technical scorecard rather than comparing price per wafer alone. A practical weighting may include:
- 25% crystal orientation, thickness, and lot uniformity.
- 20% surface and particle inspection capability.
- 20% bonding-interface quality for LNOI.
- 15% RF coupon data and measurement traceability.
- 10% packaging, delivery, and replacement policy.
- 10% engineering support and ability to produce custom cuts or thicknesses.
Ask CQT or any competing supplier for the same data template. The request should identify the measurement equipment, method, sampling plan, uncertainty, and lot traceability. A supplier that cannot provide these details may still offer usable material, but the buyer should budget for independent incoming inspection and a larger process-development split.
Lithium Niobate Wafer Inspection Checklist
- Confirm wafer diameter, thickness, notch or flat, and usable area.
- Confirm the crystallographic cut, in-plane propagation direction, and angular tolerance.
- Confirm stoichiometric or congruent composition and any MgO or other doping.
- Confirm single-side or double-side polish and the roughness test method.
- Review scratches, pits, particles, haze, edge chips, and edge exclusion.
- Review wafer bow, warp, total thickness variation, and film-thickness maps.
- For LNOI, inspect bonding voids, interface particles, delamination, and buried-layer uniformity.
- Confirm packaging, storage, cleaning compatibility, and lot traceability.
- Fabricate RF coupons at multiple wafer coordinates.
- Measure S-parameters with documented VNA calibration and de-embedding.
- Measure resonance, Q, coupling, insertion loss, and temperature drift.
- Compare results with the pre-agreed acceptance limits before releasing the lot.
Summary: The Safest Way to Choose Lithium Niobate Wafers for High-Frequency RF
The correct lithium niobate wafer is the one that matches the complete RF stack, not merely the requested material name. Begin with frequency and acoustic mode, convert them into wavelength and film-thickness requirements, then select the crystal cut and propagation direction. Decide between bulk LiNbO3 and LNOI by modelling acoustic leakage, thermal behavior, and process complexity.
Before production approval, require orientation documentation, thickness and bow maps, surface and particle data, bonding inspection for LNOI, and RF coupon measurements. Use a calibrated vector network analyzer and report the measurement conditions. Treat k2, Q, TCF, and insertion loss as device-level results that must be verified on the intended electrode and substrate stack.
For a first order, request samples from at least two lots, fabricate identical test structures at center and edge locations, and compare the frequency spread and loss distribution. This process costs more than selecting a wafer from a catalog, but it reduces the risk of discovering orientation errors, bonding voids, or thickness nonuniformity after a high-cost lithography cycle. A supplier such as CQT should be evaluated using the same documented inspection and RF qualification criteria as every other candidate.
Related technical terms: lithium-niobate-on-insulator, acoustic velocity, temperature coefficient of frequency, wafer bow, bonding voids, RF loss, and resonator quality factor.