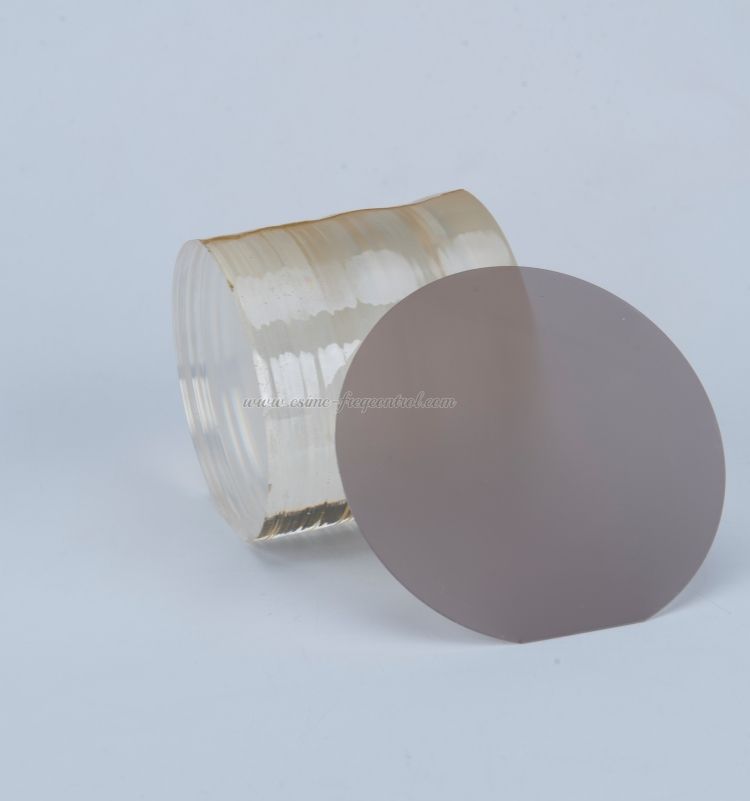
Lithium Tantalate Wafers are a key material choice for surface acoustic wave devices that must maintain stable frequency across temperature, aging, drive power, and production variation. Engineers, sourcing teams, and device manufacturers usually want more than a basic material definition. They need a practical way to connect wafer properties with frequency drift, compare material options, qualify suppliers, and prevent failures before mass production. This guide explains the complete evaluation process and shows how CQT can support material selection and frequency control.
Start by connecting each material property to the frequency stability problem
Understand why material properties change the resonant frequency
A SAW device converts an electrical signal into a surface acoustic wave through an interdigital transducer. The device frequency is mainly determined by the acoustic velocity and the electrode period. A simplified relationship is:
Frequency = Acoustic velocity / Wavelength
Because the wavelength is defined by the electrode geometry, any material property that changes acoustic velocity can shift the operating frequency. The most important causes include:
- Temperature-dependent elastic constants.
- Thermal expansion of the wafer and electrode structure.
- Mass loading from metal electrodes, passivation layers, and contaminants.
- Crystal cut and propagation direction.
- Wafer thickness and backside condition.
- Surface roughness and local defects.
- Electrical permittivity and electromechanical coupling.
- Material aging, stress relaxation, and moisture absorption in surface coatings.
Prioritize the properties that purchasing and engineering teams can control
Purchasing groups typically need a clear connection between a specification and a commercial risk. A long material datasheet is not enough unless each value explains how it affects yield, frequency drift, or device lifetime.
- Crystal cut: Determines the acoustic mode, temperature coefficient, coupling behavior, and spurious response.
- Propagation direction: Influences acoustic velocity, power handling, and frequency response.
- Temperature coefficient of frequency: Indicates how much frequency changes as temperature changes.
- Electromechanical coupling coefficient: Affects filter bandwidth, insertion loss, and design flexibility.
- Resistivity: Influences electrical loss and compatibility with electrode processing.
- Surface roughness: Can increase scattering, reduce quality factor, and create device-to-device variation.
- Thickness uniformity: Reduces variation in wafer stress, processing behavior, and acoustic performance.
- Defect density: Impacts yield, reliability, and local frequency consistency.
Evaluate temperature behavior before selecting a SAW wafer
Measure the first-order temperature coefficient of frequency
Temperature is one of the most common causes of frequency instability. As temperature changes, the elastic properties and dimensions of the piezoelectric substrate change. The resulting frequency shift is commonly described by the first-order temperature coefficient of frequency, or TCF.
A practical approximation is:
Frequency shift in ppm = TCF in ppm per C x Temperature change in C
For example, if a device has a TCF of -35 ppm per C and the operating temperature increases by 40 C, the approximate frequency shift is -1,400 ppm before considering second-order effects, packaging stress, and electrode effects.
Check second-order temperature behavior across the complete operating range
A device can appear stable near room temperature but drift significantly at the upper or lower limit of its operating range. The frequency-temperature curve may be nonlinear, so testing only at 25 C can hide important risks.
Use a temperature profile that reflects the actual application:
- Define the minimum, nominal, and maximum operating temperatures.
- Stabilize the device at the minimum temperature.
- Measure the center frequency, insertion loss, and bandwidth.
- Increase temperature in controlled steps, such as 10 C or 20 C.
- Allow the device to reach thermal equilibrium at every step.
- Repeat the measurement at the nominal and maximum temperatures.
- Return to room temperature and compare the final result with the initial result.
- Fit the frequency data to a first-order or second-order temperature model.
Compare material, electrode, and package contributions
Temperature drift is rarely caused by the wafer alone. The electrode metal, passivation layer, adhesive, package, and mounting stress can all change the effective acoustic velocity. During qualification, separate the contributions where possible.
- Test a bare wafer or test coupon to establish substrate behavior.
- Test a metallized structure to quantify electrode mass loading.
- Test the packaged component to identify package stress and thermal expansion effects.
- Compare heating and cooling curves to identify hysteresis.
- Repeat the test after humidity exposure to detect coating or package effects.
Use crystal cut and orientation to control acoustic performance
Confirm the wafer cut and propagation direction
Piezoelectric crystals are anisotropic, which means their mechanical and electrical behavior depends on direction. Two wafers made from the same chemical material can produce different device performance when their crystal cuts or propagation directions differ.
Before approving a wafer specification, record:
- Crystal material and crystal family.
- Cut type and cut angle.
- Propagation direction.
- Wafer diameter.
- Wafer thickness and thickness tolerance.
- Frontside and backside orientation marks.
- Polishing direction, if relevant to the process.
Relate orientation to frequency, coupling, and spurious modes
Crystal orientation affects acoustic velocity and electromechanical coupling. It can also change the strength of unwanted modes. A cut that provides strong coupling for a wideband filter may not provide the lowest temperature drift for a narrowband reference device.
Evaluate the following trade-offs:
- Higher coupling: May support wider bandwidth but can increase sensitivity to design and parasitic effects.
- Lower temperature drift: May improve frequency stability but can limit bandwidth or require compensation layers.
- Low spurious response: May improve filter rejection and reduce unwanted resonances.
- High power tolerance: May be necessary for transmit applications and high-drive oscillators.
- Process compatibility: The selected cut must remain stable during cleaning, coating, lithography, and metallization.
Verify orientation with documentation and incoming inspection
Do not rely only on a supplier part number. Require a certificate that identifies the cut, orientation, thickness, diameter, and inspection method. Incoming inspection should confirm the marking scheme and detect mixed lots.
- Match the purchase order with the supplier certificate.
- Check wafer identification and orientation marks.
- Inspect the surface for chips, cracks, stains, and handling damage.
- Measure a sample of wafers for diameter and thickness.
- Use an X-ray diffraction or equivalent crystallographic method when cut angle is critical.
- Record the lot number in the device qualification database.
Control wafer thickness, flatness, and surface quality to reduce variation
Specify thickness and total thickness variation
Wafer thickness affects handling, mechanical stress, thermal behavior, and process uniformity. Total thickness variation can create differences between dies, especially when the device design or packaging process is sensitive to mechanical boundary conditions.
A purchasing specification should define:
- Nominal wafer thickness.
- Allowed thickness tolerance.
- Total thickness variation across the wafer.
- Bow and warp limits.
- Edge exclusion zone.
- Backside finish and roughness.
- Measurement location, sample size, and instrument accuracy.
Inspect surface roughness and defects
SAW energy is concentrated near the surface. Scratches, pits, particles, polishing marks, and local roughness can scatter acoustic energy and create nonuniform electrical response. These defects may reduce quality factor, increase insertion loss, or cause frequency variation across the wafer.
Use a defect classification system that separates:
- Cosmetic defects that do not affect the active area.
- Defects inside the active area.
- Defects near the wafer edge.
- Particles that can be removed by cleaning.
- Permanent scratches, pits, cracks, and delamination.
Map wafer uniformity instead of checking only a center point
A center-point measurement can pass while the wafer edge fails. Create a measurement map with center, middle-radius, and edge locations. For high-volume production, correlate wafer maps with die frequency maps and yield data.
- Divide the wafer into a defined grid or radial measurement pattern.
- Measure thickness, bow, roughness, and defect counts at each location.
- Mark all nonconforming areas in a wafer map.
- Process test patterns from multiple wafer locations.
- Compare the electrical frequency map with the physical property map.
- Set an acceptance rule based on the worst location, not only the average value.
Follow a step-by-step material qualification process
First step: define the device and purchasing requirements
Start with the application rather than a generic wafer request. The correct material depends on frequency, bandwidth, temperature range, power level, package, and production method.
- Operating frequency and allowable frequency drift.
- Operating temperature range.
- Required insertion loss and quality factor.
- Bandwidth and rejection requirements.
- Continuous-wave or pulsed power level.
- Expected operating lifetime.
- Wafer diameter and annual volume.
- Required delivery schedule and lot size.
- Traceability and quality documentation.
Second step: create a supplier comparison matrix
Use one standardized table for every candidate supplier. This prevents a low price from hiding a higher defect rate, longer inspection time, or inconsistent frequency performance.
| Category |
Required information |
Why it matters |
| Material |
Crystal type, cut, orientation, and grade |
Determines acoustic and electrical behavior |
| Geometry |
Diameter, thickness, tolerance, bow, and warp |
Controls process compatibility and uniformity |
| Surface |
Roughness, particles, scratches, and edge condition |
Influences yield and acoustic loss |
| Electrical |
Resistivity, dielectric properties, and coupling data |
Supports electrode and circuit design |
| Thermal |
TCF data and measurement conditions |
Predicts frequency drift over temperature |
| Quality |
Inspection plan, certificate, traceability, and change control |
Reduces supply and production risk |
Third step: request samples from more than one lot
One wafer or one lot cannot demonstrate long-term consistency. Request samples from at least two or three production lots when the project will enter volume manufacturing.
- Request a technical datasheet and certificate template.
- Ask for representative specification limits, not only typical values.
- Receive samples from separate production lots.
- Inspect the wafers using the same equipment planned for production.
- Fabricate identical test structures on every candidate material.
- Record electrical and physical data by wafer, lot, and die location.
Fourth step: fabricate a controlled test structure
Use the same electrode material, electrode thickness, lithography conditions, cleaning process, and packaging method for every candidate. If the process changes between materials, the comparison will not isolate the wafer effect.
The test structure should include:
- Resonators for center frequency and quality factor.
- Delay lines for acoustic velocity and propagation loss.
- Temperature test structures.
- Power stress structures.
- Alignment and process control marks.
- Structures at different wafer locations.
Fifth step: measure and analyze the results
Measure the same parameters under identical conditions. Calculate average values, standard deviation, wafer-to-wafer variation, lot-to-lot variation, and temperature drift.
- Measure room-temperature frequency before environmental testing.
- Measure insertion loss, bandwidth, and quality factor.
- Run the temperature sweep.
- Run humidity and thermal cycling when required by the application.
- Apply power stress and monitor frequency recovery.
- Repeat the room-temperature measurement after stress.
- Compare all results with the original acceptance limits.
Sixth step: approve the material with a controlled change process
Material approval should include technical, quality, and commercial conditions. A supplier must not change crystal cut, polishing process, inspection method, or source material without notification and requalification.
- Approved material specification.
- Approved supplier and manufacturing site.
- Lot traceability rules.
- Incoming inspection plan.
- Process change notification period.
- Requalification requirements.
- Corrective action response time.
- Packaging and storage conditions.
Use the right tools to measure frequency stability accurately
Required tools for material and device evaluation
The following tools provide a practical starting point for wafer qualification and SAW device analysis:
- Vector network analyzer for S-parameter measurement.
- Temperature chamber with calibrated sensors.
- Frequency counter or frequency measurement system.
- Probe station or controlled RF fixture.
- Optical microscope for surface and edge inspection.
- Surface profilometer or atomic force microscope for roughness measurement.
- Thickness gauge or mapping system.
- Bow and warp measurement system.
- Particle counter or wafer inspection system.
- Humidity chamber for moisture testing.
- Power amplifier and controlled RF source for drive testing.
- Data acquisition software for temperature and time-based measurements.
- Calibration standards, reference substrates, and measurement cables.
- Cleanroom tools for handling, cleaning, and packaging.
Calibrate the measurement chain before testing
Measurement error can be mistaken for material instability. Before testing, calibrate the complete RF path and verify the temperature measurement system.
- Warm up the vector network analyzer according to the manufacturer instructions.
- Perform a full calibration at the connector or probe reference plane.
- Verify calibration with a known standard device.
- Check cable movement and fixture repeatability.
- Confirm that the temperature sensor is positioned close to the device.
- Allow the test fixture to reach thermal equilibrium.
- Repeat a reference measurement at the beginning and end of the test.
Separate measurement repeatability from material variation
Measure the same device multiple times before assigning variation to the wafer. If repeated measurements vary more than the material comparison, improve the fixture, calibration, contact pressure, shielding, or thermal stabilization.
Report at least the following statistical results:
- Average frequency.
- Minimum and maximum frequency.
- Standard deviation.
- Frequency shift per temperature interval.
- Lot-to-lot difference.
- Wafer center-to-edge difference.
- Pre-stress and post-stress recovery.
Avoid common mistakes that create false frequency stability conclusions
Do not compare wafers with different processing conditions
Different electrode thickness, metal composition, cleaning chemistry, or passivation thickness can change the result. A fair comparison requires a controlled process flow.
- Use the same electrode deposition recipe.
- Use the same lithography and etching conditions.
- Use the same die layout and electrode dimensions.
- Use the same package and mounting method.
- Use the same RF power and measurement bandwidth.
Do not use typical supplier values as guaranteed limits
Typical values describe an average result. They do not define the worst-case performance that purchasing and production teams need for risk control. Request minimum, maximum, and test-condition information for every critical parameter.
Do not test only at room temperature
Room-temperature measurements cannot reveal the complete temperature curve, thermal hysteresis, or recovery behavior. Always test across the actual application range and include thermal cycling when the device will experience repeated temperature changes.
Do not ignore packaging and electrode effects
A wafer can show acceptable temperature behavior while the final device fails because of package stress, adhesive expansion, electrode mass loading, or protective coating changes. Qualification must include the intended final structure.
Do not treat average wafer data as proof of uniformity
Average values can hide edge defects and local frequency shifts. Use spatial maps and correlate electrical test results with wafer location.
Do not overlook storage and handling conditions
Moisture, contamination, particles, and improper handling can damage the surface or alter the measurement. Store and transport wafers in clean, dry, appropriately sealed packaging, and define the maximum exposure time before processing.
Choose a supplier that can reduce technical and purchasing risk
Evaluate technical capability and documentation quality
The supplier should provide more than a product name. A reliable supplier can explain the relationship between material properties and device performance, provide traceable inspection results, and support custom specifications.
Ask prospective suppliers for:
- Material and crystal cut documentation.
- Wafer thickness and uniformity data.
- Surface roughness and defect inspection criteria.
- Temperature coefficient information and test conditions.
- Sample lot history and consistency data.
- Packaging, storage, and handling instructions.
- Change notification and corrective action procedures.
- Application support during device qualification.
Compare total cost instead of unit price alone
The lowest wafer price may create higher total cost if it causes more incoming inspection, lower die yield, process rework, or field failures. Purchasing teams should compare:
- Price per usable wafer.
- Expected die yield.
- Inspection and sorting cost.
- Lead time and safety stock requirements.
- Lot consistency.
- Technical support availability.
- Warranty and corrective action response.
- Long-term supply capacity.
Use CQT as a technical partner during qualification
CQT can support the evaluation of Lithium Tantalate Wafers by helping customers define wafer specifications, review crystal orientation requirements, organize sample testing, and connect material data with SAW device performance. A structured qualification process helps engineering teams reduce redesign risk and helps purchasing teams approve a stable, traceable supply source.
Build a final acceptance checklist for frequency-stable SAW devices
Confirm material and geometry requirements
- Crystal material is approved.
- Crystal cut and propagation direction are verified.
- Wafer diameter meets the process requirement.
- Thickness and total thickness variation meet the specification.
- Bow and warp are within limits.
- Surface roughness meets the active-area requirement.
- Defect and particle levels are acceptable.
- Packaging protects the wafer during transport and storage.
Confirm electrical and thermal performance
- Center frequency meets the design target.
- Wafer-to-wafer and lot-to-lot variation are controlled.
- Temperature coefficient meets the application limit.
- Frequency recovery after thermal cycling is acceptable.
- Insertion loss and quality factor meet the target.
- Spurious responses are within the permitted range.
- Power stress does not create excessive permanent frequency shift.
- Final packaged devices remain within specification.
Confirm supply and change-control requirements
- Supplier certificates are complete and traceable.
- Inspection methods are documented.
- Production lots can be identified and retained.
- Material changes require advance notification.
- Requalification criteria are agreed in writing.
- Delivery capacity supports the production forecast.
- Corrective action and technical support contacts are defined.
In summary, frequency stability in a SAW device depends on the combined behavior of the piezoelectric wafer, crystal orientation, temperature response, surface condition, electrode structure, package, and measurement system. A step-by-step qualification process using controlled test structures, calibrated tools, spatial wafer mapping, and documented supplier controls provides a reliable basis for material selection. With the right specifications and supplier support, Lithium Tantalate Wafers from CQT can help manufacturers achieve more predictable frequency performance from prototype validation through volume production.









 中文


